If your quality plan calls for inspecting 10% of production, you have quietly made a decision that goes far beyond the inspection department. You have decided that 90% of what leaves your plant will never be checked. Most quality teams know this trade-off exists. Few have put a number on what it actually costs when the sample misses something the full population would have caught.
Sampling plans exist for good reasons: throughput, labor cost, and the practical limits of manual or lab-based measurement. Standards like ANSI/ASQ Z1.4 and ISO 2859 give quality teams a defensible, statistically grounded way to decide how many units to check out of a lot. The math behind these standards works well for one specific situation: defects that occur randomly and independently across a stable, well-behaved process. The problem is that a lot of real manufacturing does not behave that way, and the defects that escape a sample are rarely the harmless kind.
The Assumption Sampling Depends On
A sampling plan is really a bet about the shape of your defect distribution. If defects are rare, random, and evenly spread across a production run, a well-designed sample gives you a reasonable statistical estimate of the lot's overall quality. That is the assumption baked into every AQL table.
A quick primer: what is an AQL table? An AQL, or Acceptable Quality Limit, table is the reference chart behind most sampling plans, most commonly drawn from the ANSI/ASQ Z1.4 or ISO 2859 standards. You choose an acceptable defect rate, say 1.5%, look up your lot size, and the table returns two numbers: how many units to sample and how many defects in that sample are allowed before the whole lot is rejected. Inspect a 10,000-unit lot at that AQL, for example, and the table might call for a 200-unit sample, accepted if 5 or fewer are defective. The math behind the table is a probability calculation, and it only holds if defects are scattered randomly through the lot. That is precisely the assumption the next section shows breaking down.
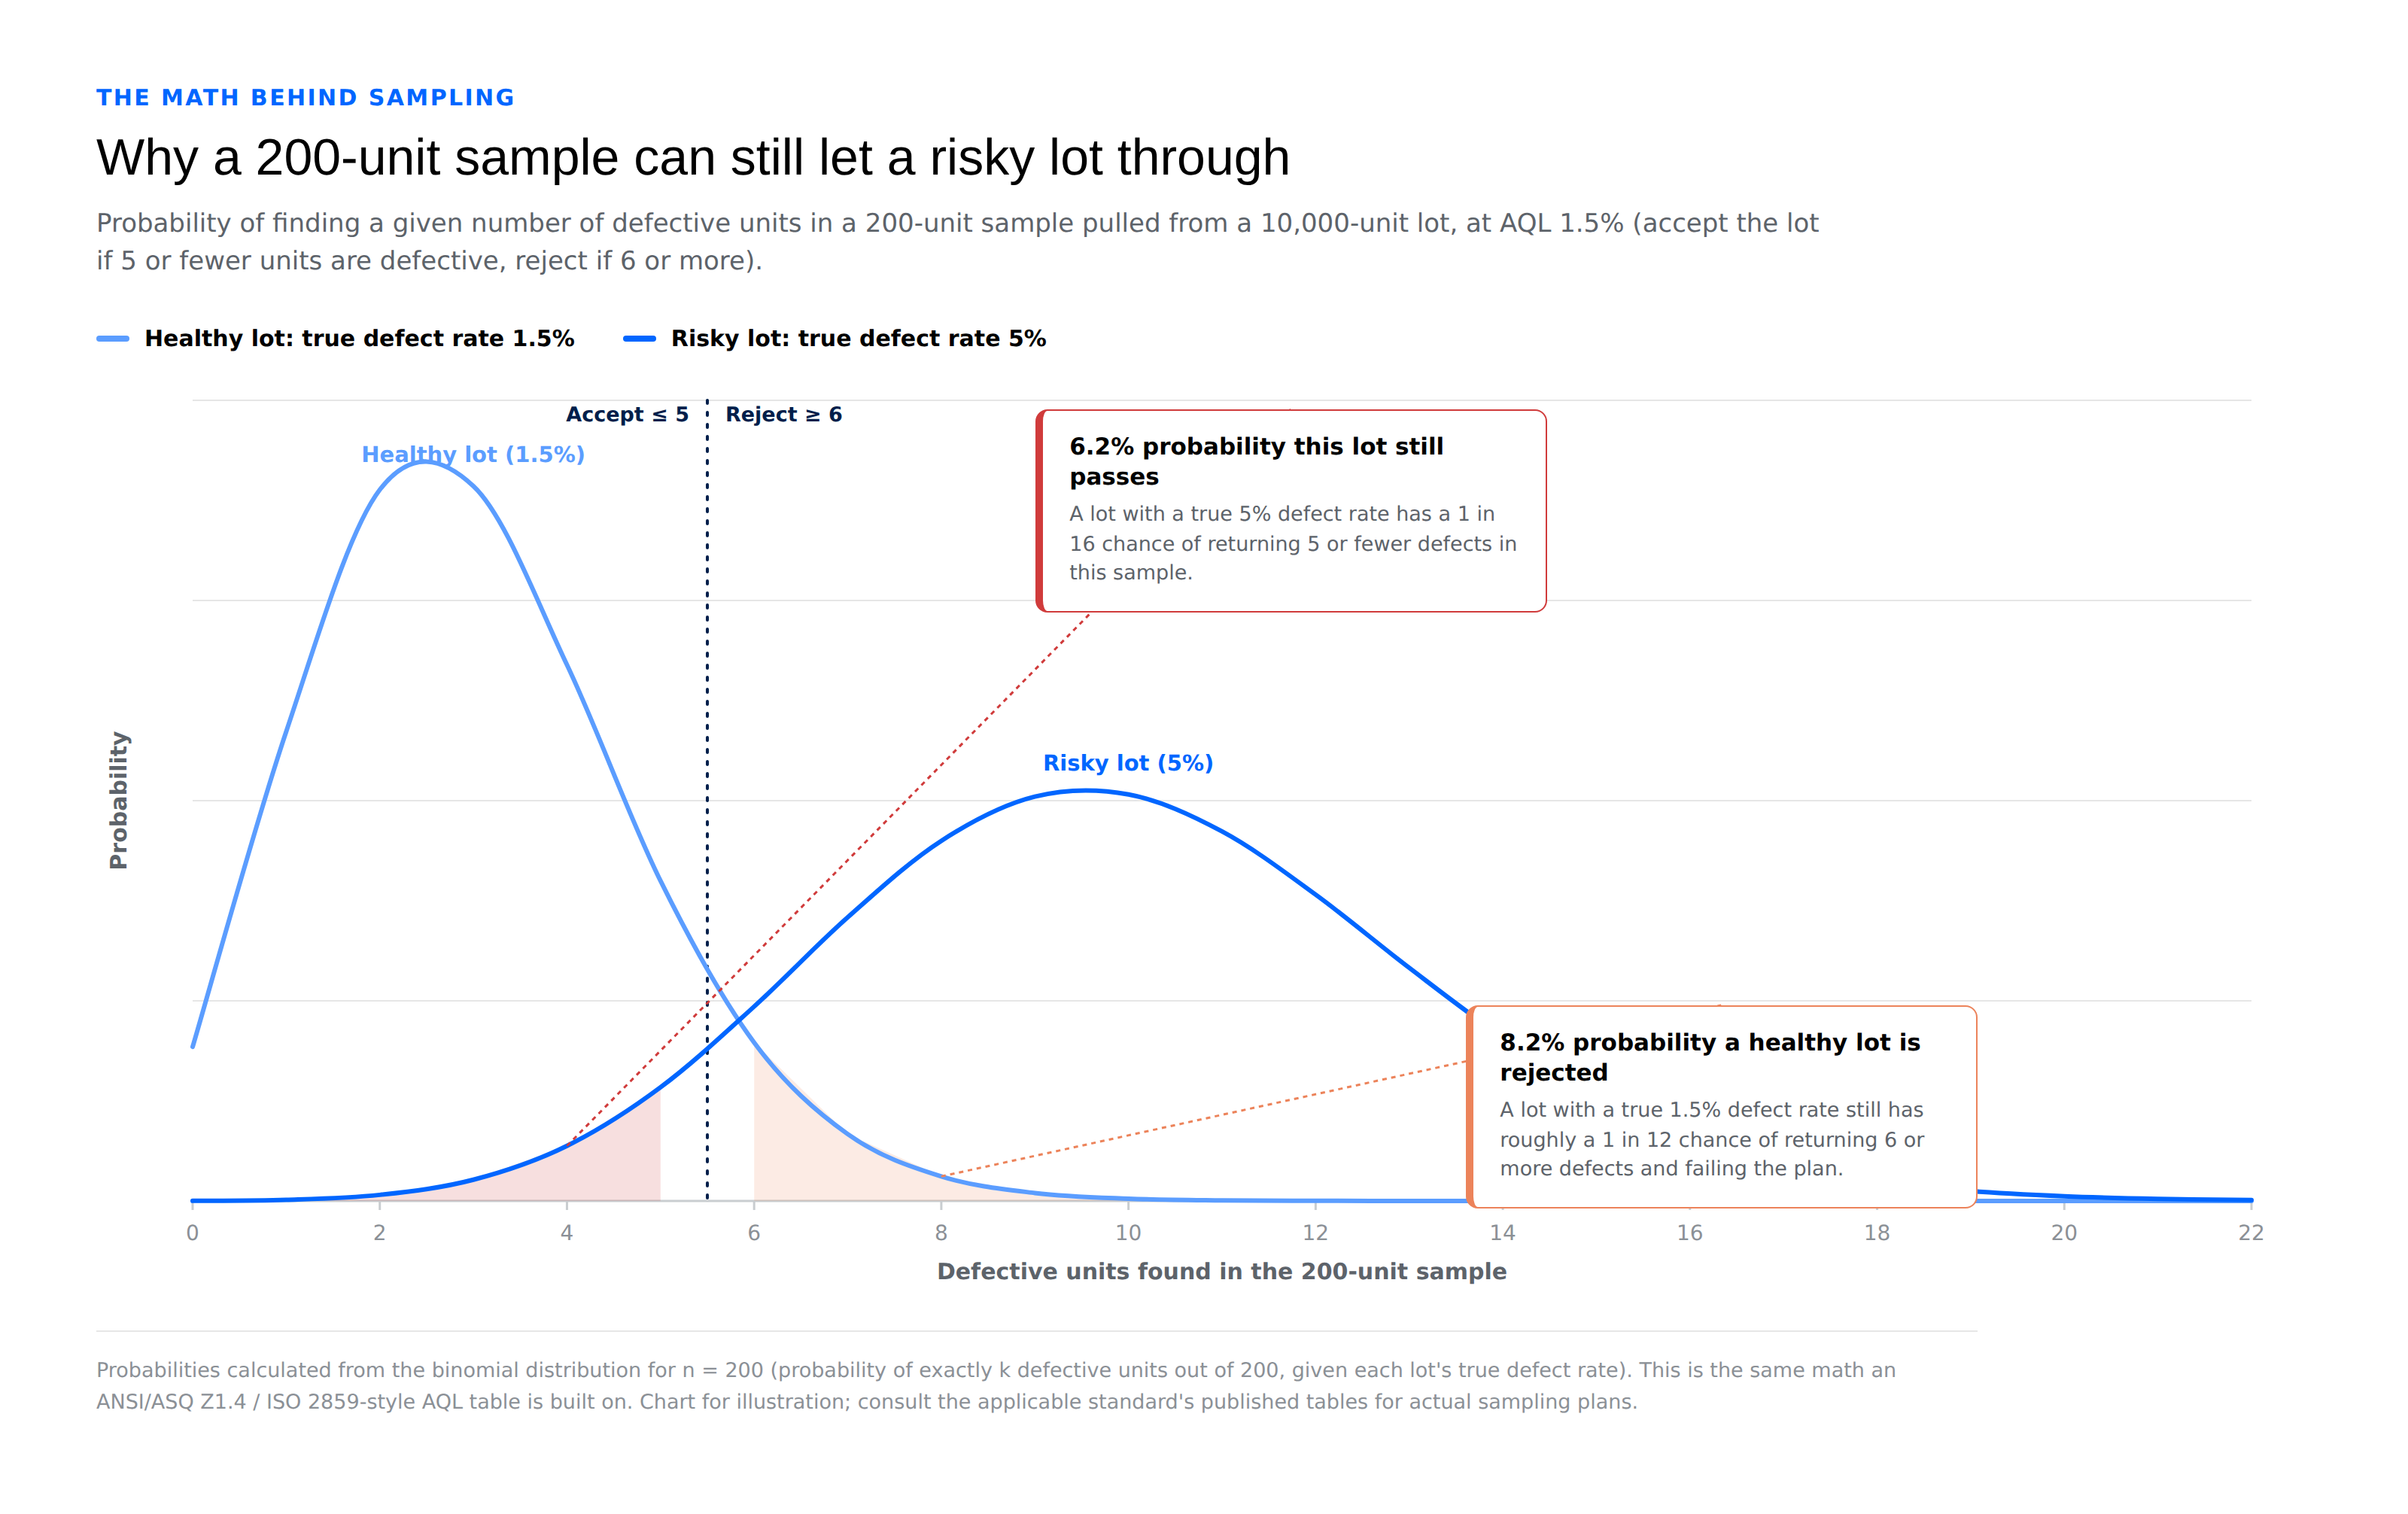
Production floors do not always cooperate. Processes drift. Operators change between shifts. Tooling wears unevenly. Manual and semi-automated steps introduce variation that has nothing to do with random chance and everything to do with what happened on the line that hour. When the defect distribution stops being random, the statistical guarantee behind sampling quietly stops applying, and nobody tells the quality manager when that happens.
Five Defect Patterns That a 10% Sample Is Built to Miss
The lone outlier versus the emerging trend
A single bad part is easy to write off as noise. The harder problem is telling that lone outlier apart from the first data point in a trend that will keep getting worse. A sample taken once per shift, or once per lot, cannot distinguish between the two until the trend has already produced a run of defective parts, and by then the damage is already downstream.
Human-driven variability in chaotic processes
Manual and semi-automated processes, welding is the classic example, do not produce uniform output the way a fully automated, tightly controlled process does. Torch angle, travel speed, arc length, and operator fatigue all vary from weld to weld and from person to person. This is exactly the kind of process where the "random and independent" assumption behind AQL sampling breaks down, because the variation is driven by people and conditions, not chance.
The missing element
Omission errors, a missing screw, a skipped fastener, an uninstalled clip, are often the most preventable defects and the most expensive to let through. They are frequently tied to a specific operator, shift, or station rather than distributed randomly across the run, which means a random sample can walk right past a cluster of them.
Intermittent equipment malfunctions
Tooling and automated equipment do not always fail cleanly. A sensor that reads correctly nine times out of ten, a fixture that clamps inconsistently, a dispensing head that occasionally under-fills, these intermittent failures are, by definition, not present in every part. A sample taken at any given moment may simply catch the equipment on a good cycle.
Plain statistical bad luck
Even when a sampling plan is executed exactly as designed, on a process that genuinely does behave randomly, there is still a real probability that the sample happens to miss the defective units in that particular lot. This is not a failure of discipline. It is how sampling works. The plan was never built to catch everything; it was built to catch most things, most of the time.
What Escaping Defects Actually Cost
The costs on the other side of a missed defect are not abstract. They show up in three places:
-
Scrap and rework inside the plant,
-
Recalls and replacements after the product ships, and
-
Damage to brand equity that outlasts the financial hit.
Cost of poor quality, the combined bill for scrap, rework, warranty claims, and recall response, is not a fringe expense. The American Society for Quality has long estimated that quality-related costs, prevention, appraisal, and failure costs combined, run 15 to 20% of annual sales at many manufacturers. Other industry benchmarking puts the full range wider still, from roughly 10% of revenue at typical operations up to 30% at weaker performers, with world-class plants holding total cost of poor quality under 5%. The gap between those numbers is not a rounding error; for a mid-sized manufacturer, it can represent tens of millions of dollars a year.
Scrap and rework alone follow the same pattern. According to APQC benchmarking data, scrap and rework can cost manufacturers up to 2.2% of annual revenue, compared with roughly 0.6% at top-performing plants, a nearly fourfold gap between average and best-in-class operations. On a billion-dollar revenue base, that gap alone is worth roughly 16 million dollars a year, and it is before a single recall or customer complaint enters the picture.
Recalls sit at the far end of the same spectrum, and the record shows how quickly they compound. Johnson & Johnson's 1982 Tylenol recall cost more than 100 million dollars at the time, over 260 million in today's dollars, to remove 31 million bottles from shelves. Volkswagen's emissions scandal ultimately cost more than 30 billion dollars in fines, repairs, and legal expenses, and cost the company its leading position in the American diesel market, a position competitors were happy to take. Research out of Harvard Business School on the medical device industry found that recalls do not just cost money directly; they delay a company's next product launches by roughly six months on average, handing competitors a window to capture revenue that does not come back.
None of these figures capture the slower cost: the erosion of trust with the customers, distributors, and partners who assumed the 10% sample was standing in for the other 90%.
Closing the Blind Spot
The honest answer to "how do we catch more of this" is not simply to raise the sample rate. Doubling a sample from 10% to 20% still leaves 80% of production unchecked, and it does nothing to fix the underlying issue: the defect patterns above are not random, so no fixed-percentage sample is guaranteed to catch them.
The more direct fix is to stop sampling for the defect types that sampling structurally cannot see. Trend drift needs continuous measurement, not periodic snapshots, so a shift in the process shows up after the first few parts instead of after the fiftieth. Human-driven variability in chaotic processes like welding needs measurement of every part, not an audit of a few, because the variation is part-to-part by nature. Omission errors and intermittent equipment failures need a check on every unit, since neither one respects a sampling schedule.
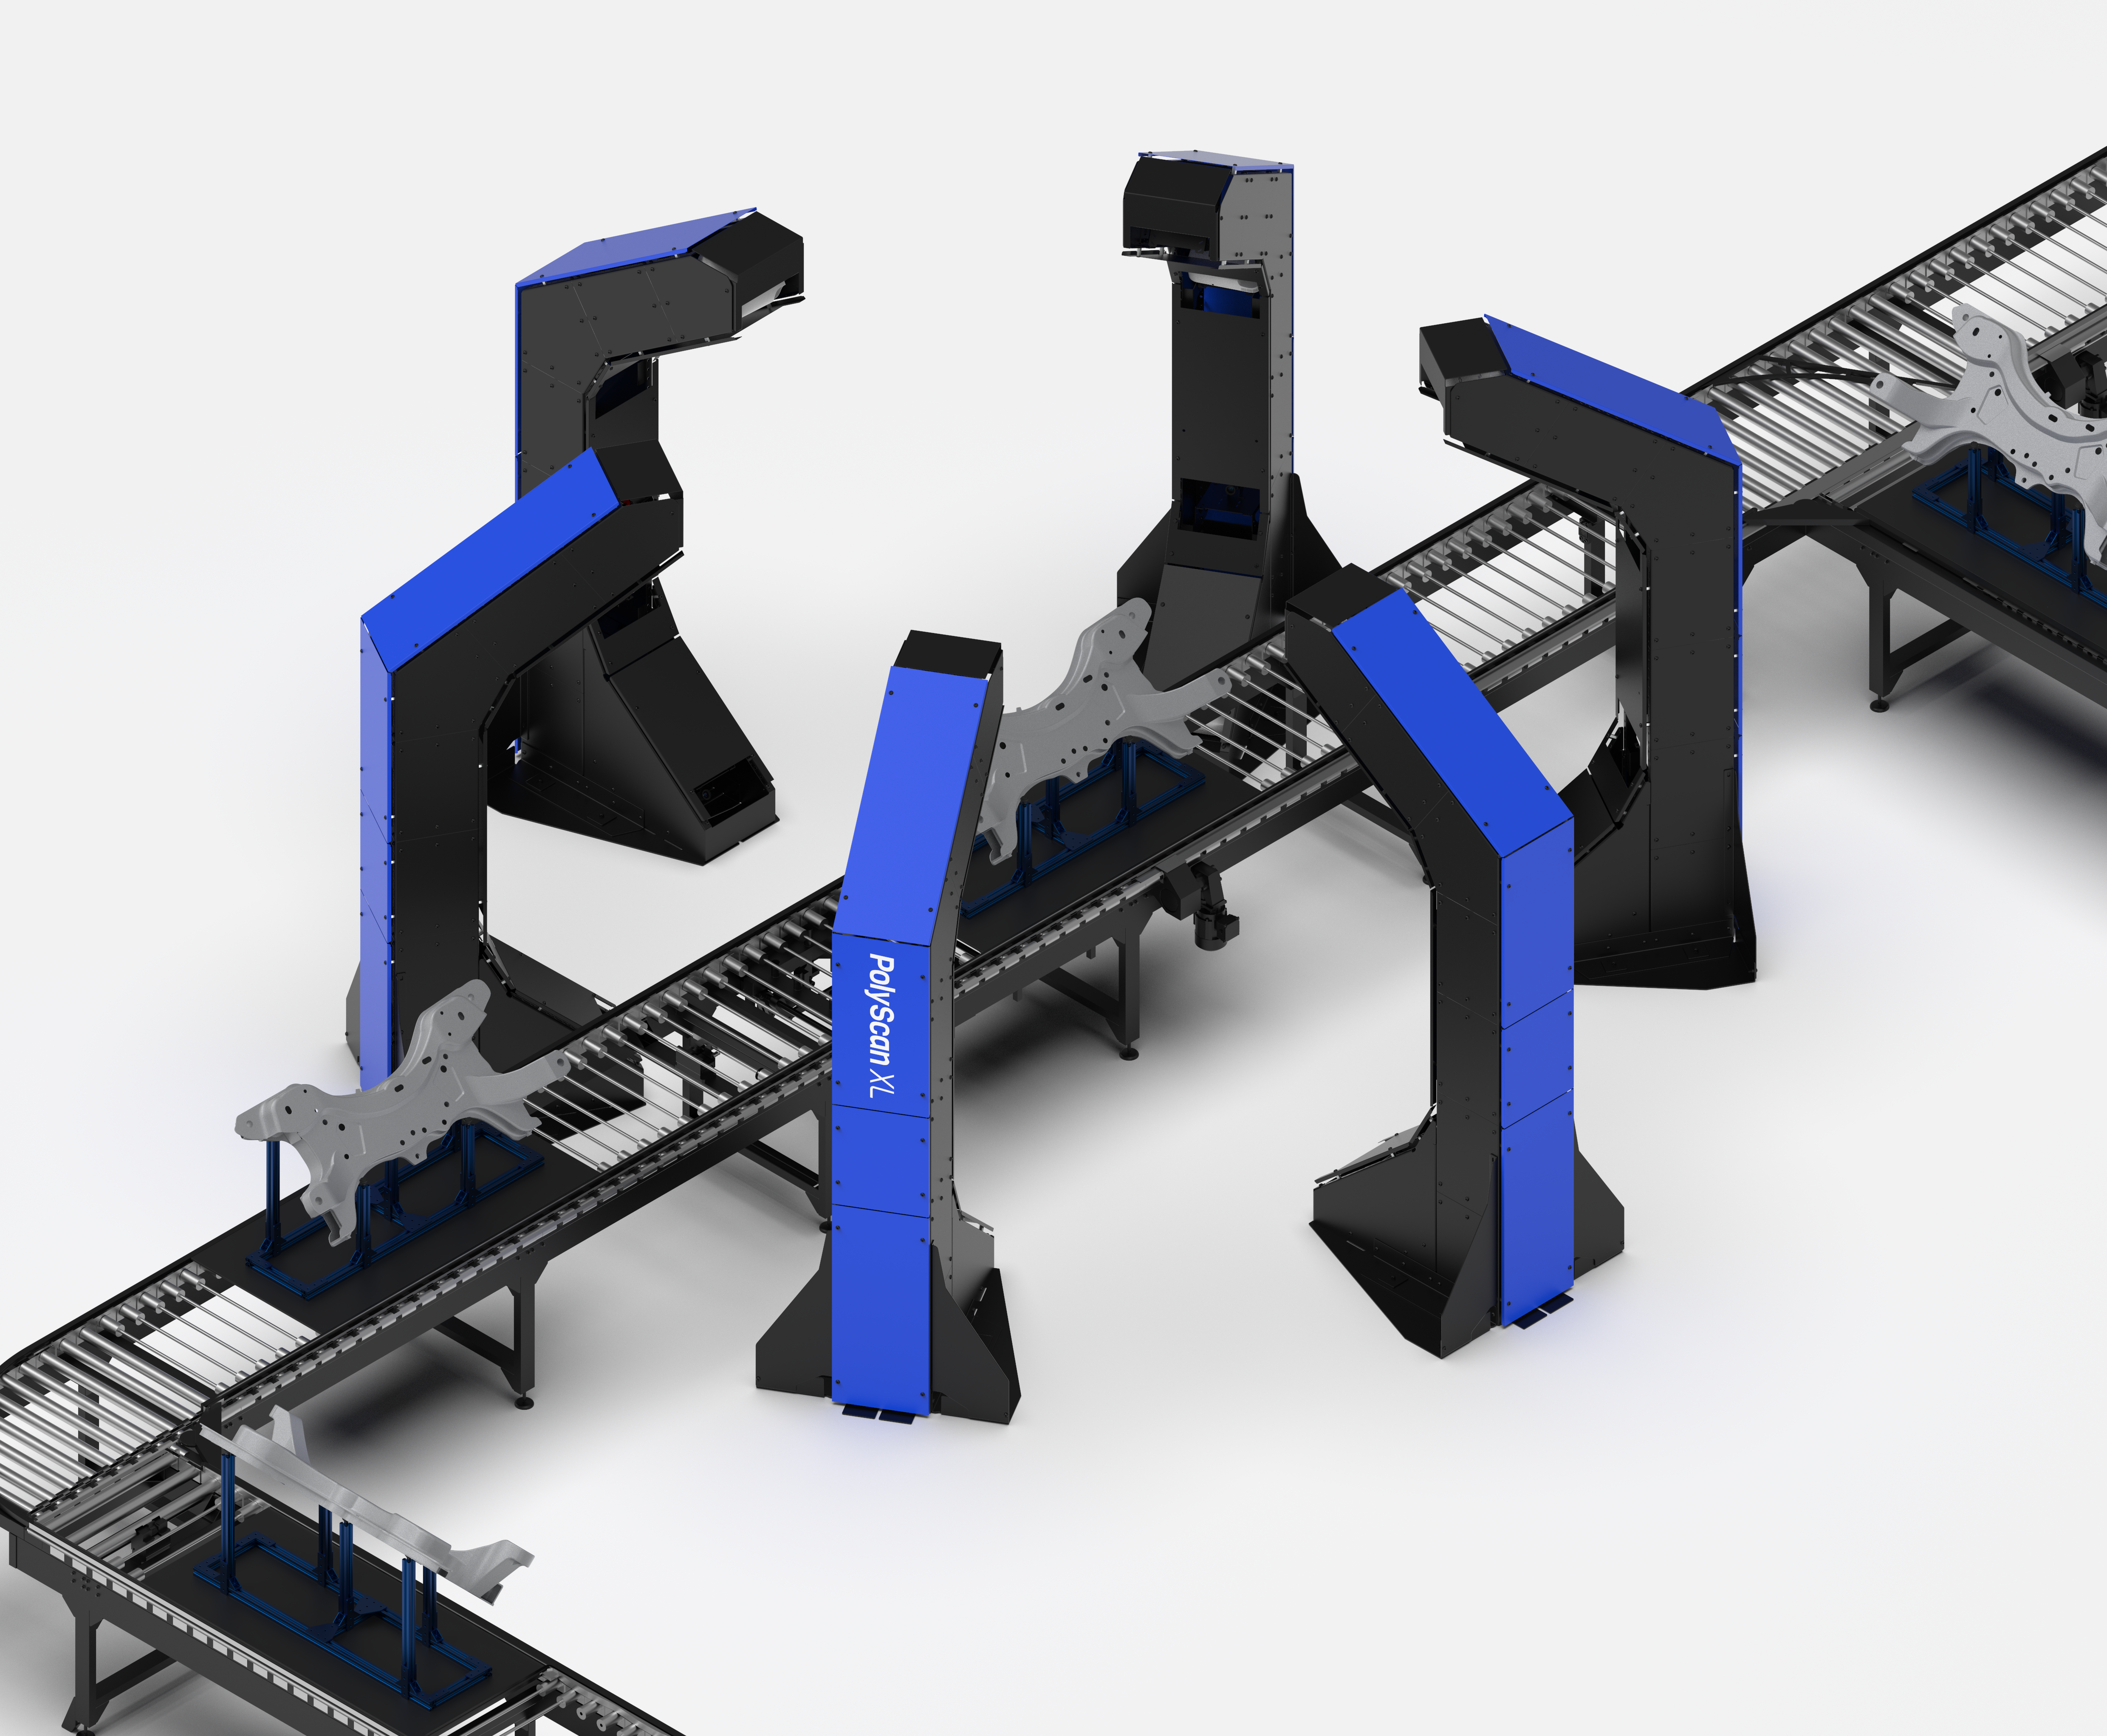
This is the logic behind moving from lab-based or periodic sampling to 100% inline inspection: measuring every part, at production speed, as it moves down the line. It does not replace statistical process control, it feeds it, turning statistical process control (SPC) from a lagging report card into a live feedback loop that flags drift while it is still one or two parts deep instead of after a rejected lot. For processes where a single missed defect can mean a warranty claim, a recall, or a safety issue, that difference between catching a trend at part three versus part three hundred is the entire business case.
The Business Case Executives Actually Need
For a plant manager, the case for 100% inspection is about scrap and rework numbers. For an executive team, the more useful framing is risk exposure: what is the cost, in dollars and in brand equity, of the defect categories a sampling plan was never designed to catch. That framing turns a metrology investment from a line-item cost into a comparison against the much larger numbers above, recall costs, delayed launches, and a cost of poor quality that can run into double-digit percentages of revenue.
The question worth putting in front of leadership is not whether the current sampling plan is well designed. It probably is. The question is whether the defects most likely to reach a customer, outliers, human-driven variability, missing elements, and intermittent malfunctions, are the kind a sample was ever built to catch in the first place.
Curious what 100% inline inspection would look like on your specific part and line? Polyrix's Simulation.Lab lets you validate coverage and cycle time before committing to hardware. Book a demo.